Using a glmnet to predict the sentiment behind Trump tweets
Building a tweet classifier from 1.6 million coded tweets.
In a previous post I categorised wine reviews based off the balance of known positive or negative words. This is a relatively simple algorithm, and I was interested in trying out Lasso and Elastic-Net Regularized Generalized Linear Models (GlmNets) as a potentially more powerful method to classify text by sentiment.
The plan
I have access to two training sets where tweets have been coded into positive or not positive sentiment.
- Model training set one (Sanders data) - 1.6 million tweets
- Model training set two (Stanford data) - 5,000 tweets
I will train two prediction models, one on each training dataset, to predict ‘positive sentiment’ using a GlmNet prediction model. I can then try out how this model works ‘out of sample’ to explore an archive of every tweet Trump has ever made.
Training a model
I didn’t really do anything special fitting this model, and there are proper GlmNet examples by statisticians on Rbloggers. So I won’t post my full code here. For a an intro to the method, this video is also really good.
Model 1 (Sanders)
Model one is based on 5,113 tweets hand coded into whether they had a positive sentiment. I did a 90/10 training/test split and 10-fold cross-validation weighting the alpha to Lasso. It ran in 4.1 seconds.
Model 2 (Stanford)
Model 2 is based on 1.6 million pre-classified tweets. I fit the same model, but this time it took 72 hours..
An important caveat for this second training set is that rather than handcoded, the sentiment classification is the product of an algorithm. This means I am training my data on a potentially flawed set of what’s positive and what’s not (as I trust an algo less than hand coding). This training set was made from an earlier model built by some guys at Stanford. So for now let’s ignore the fact that the accuracy of the training data’s classification could be low.
The data
All Trump’s tweets from 2009 to 2017 are available from github. I downloaded these tweets as the basis for most of the plots.
For the non-Trump tweets, I used the Twitter API to pull down tweets based on location.
The twitteR function is super easy to use - this simple function below was all I needed to pull down the tweets.
get_tweets <- function(
  searchterm = "trump+-RT",
  latlong = "52.205337,0.121817,10km"
){
  # Get my twitter api details
  source("~/.apikeys/twitter_keys")

# set up twitter
setup_twitter_oauth(
  twitter_consumer_key,
  twitter_consumer_secret,
  twitter_access_token,
  twitter_access_secret)

# Get some tweets
tweets <- searchTwitter(
  searchString = searchterm,
  n = 1500,
  lang = "en",
  geocode = latlong
) %>%
  twListToDF() %>%
  # convert to ASCII
  purrr::dmap_at('text', function(x) iconv(x, "latin1", "ASCII", ""))

  return(tweets)
}
Comparing the models
Sanders data
- AUC from cross-validation = 0.823
- AUC on test data = 0.803
Stanford data
- AUC from cross-validation = 0.875
- AUC on test data = 0.869
Interestingly, despite applying the same algorithm to the datasets, the resulting predictions vary greatly. It really highlights that the sentiment accuracy is really specific to the data the model was trained on. Twitter is hugely diverse, and even a sample of 1.6 million tweets is likely to create a model with poor out-of-sample performance. The following plot shows the two scores in a scatter plot.
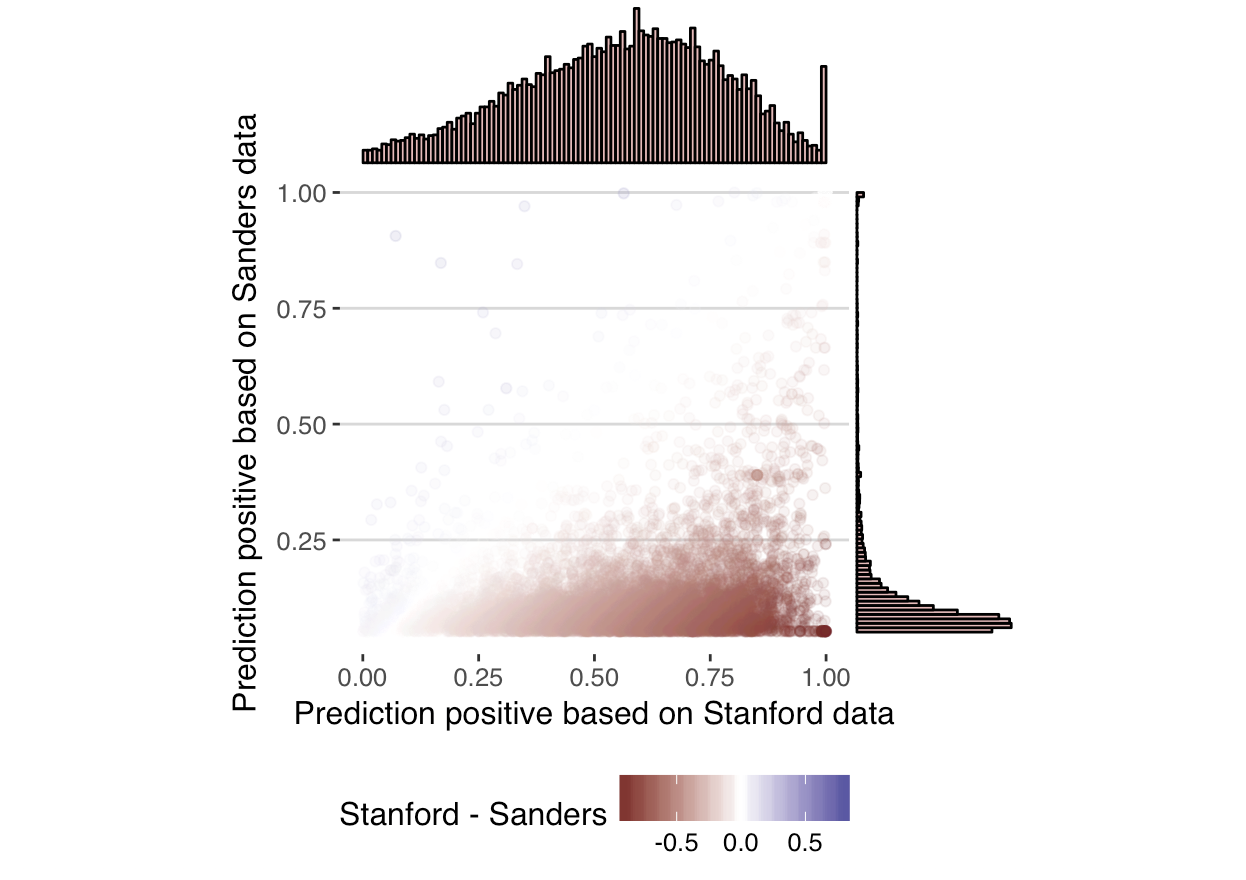
Focusing on just those with a positive sentiment prediction of > 0.99 according to the model trained on the Stanford data, and < 0.06 based on the Sanders data, led to 312 tweets. 58% (182) of these tweets where straight ‘Thank you’ tweets, suggesting the Sanders data failed to train the model to correctly identify a ‘Thank you’ tweet as positive. This might be down to the fact that the Sanders data is only tweets with set hashtags, meaning there were limited ‘thank you’ tweets to provide the necessary features to train the model.
Model failings
Going forward, I’ll focus just on the Stanford data trained classification model. Scanning through the data, it’s obvious the model isn’t perfect. Here are just a few examples of what are potentially miscoded tweets.
| Tweet text | Probability tweet is positive |
|---|---|
| I’m not afraid of failing. I don’t like to fail. I hate to fail. But I’m not afraid of it | 0.003 |
| Don’t miss me on @foxandfriends Monday at 7:30 AM | 0.03 |
| Congratulations to Miss Rhode Island on winning the Miss USA contest. She did an amazing job. | 0.13 |
| Jeb Bush - I am a conservative = Barack Obama -If you like your healthcare plan, you can keep your plan. | 0.86 |
| Watching Pyongyang terrorize Asia today is just amazing! | 0.94 |
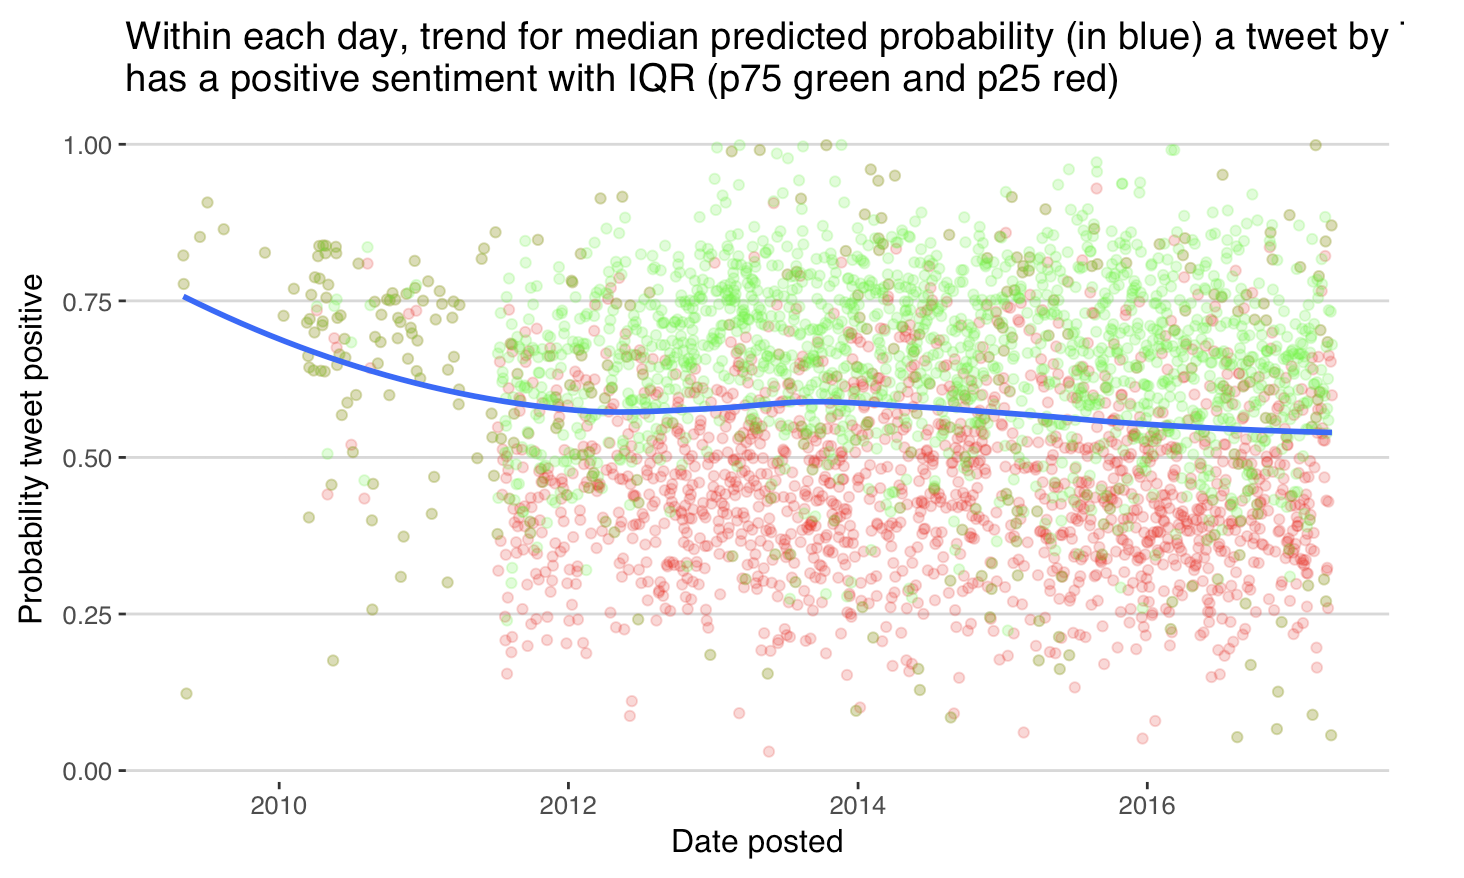
Trumps tweets over time
Accepting that the prediction has errors, the following plot shows the median sentiment of Trump’s plots over time. Here I’ve removed retweets and only plotted tweets made from Andriod. Surprisingly, there wasn’t much of a change in sentiment detected in the lead up to the election.
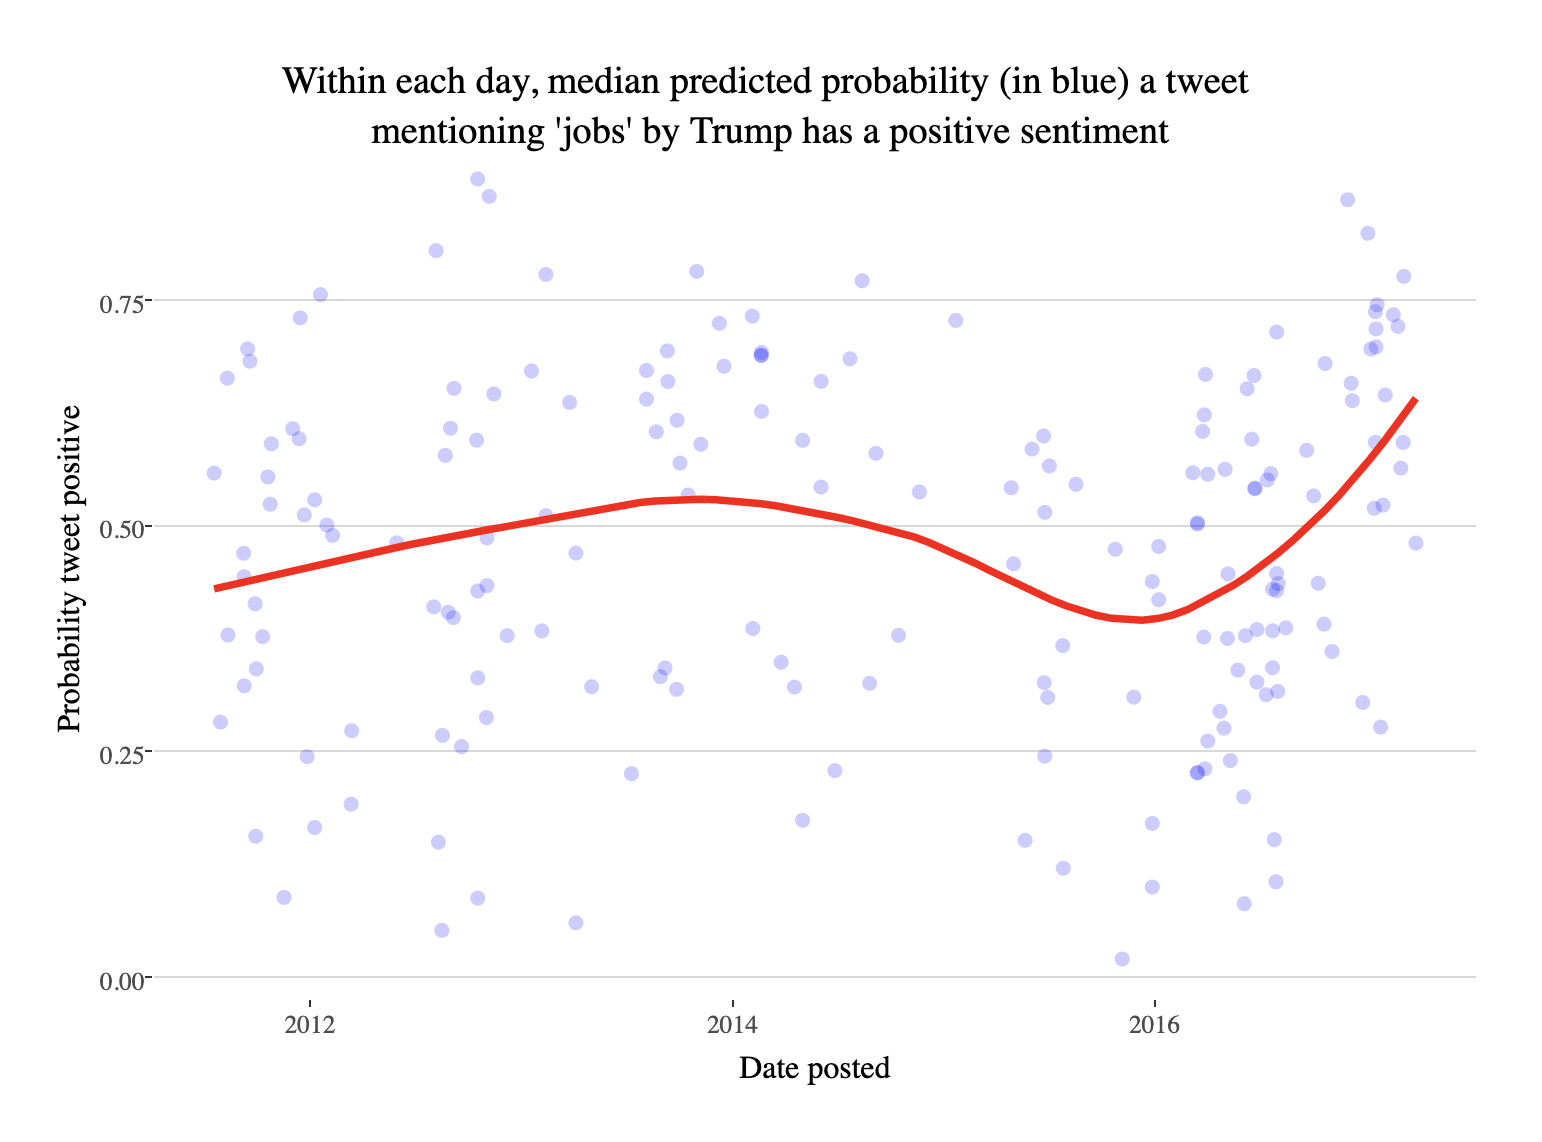
Focussing just on tweets mentioning ‘jobs’ I see a lot of variance, but maybe the makings of a meaningful trend. Note that I had to manually remove tweets about Steve Jobs (Trump is not a fan of the apple founder). The following plot shows what appears to be weak evidence of a trend to a much more positive outlook on jobs in the latter half of 2016 and early 2017.
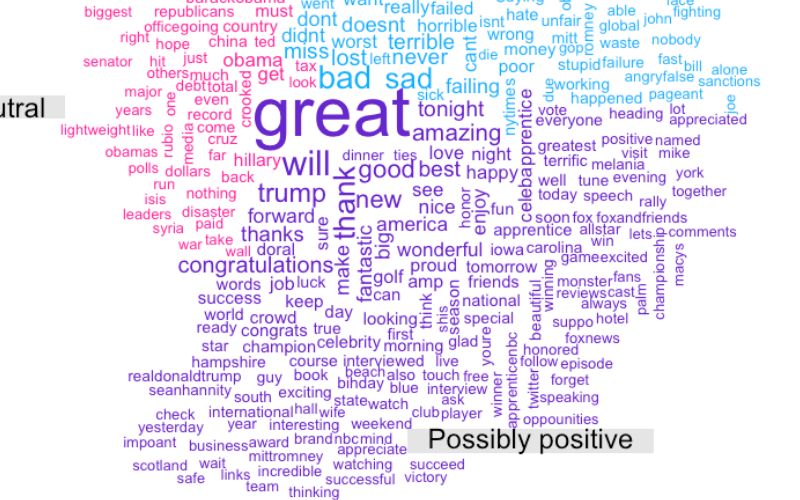
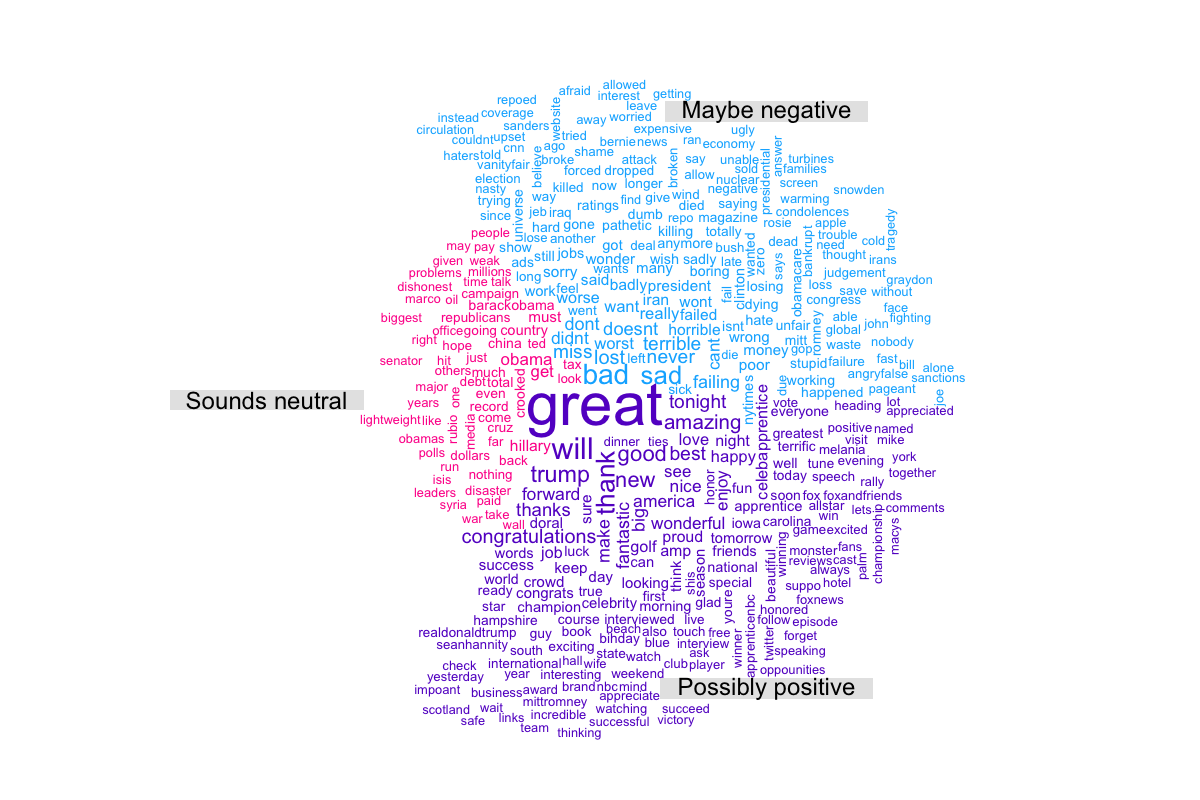
Vocab by sentiment
Out of interest I also did a word cloud of Trump’s tweets, splitting the tweets into tertiles based on the likelihood the sentiment of the tweet was positive.
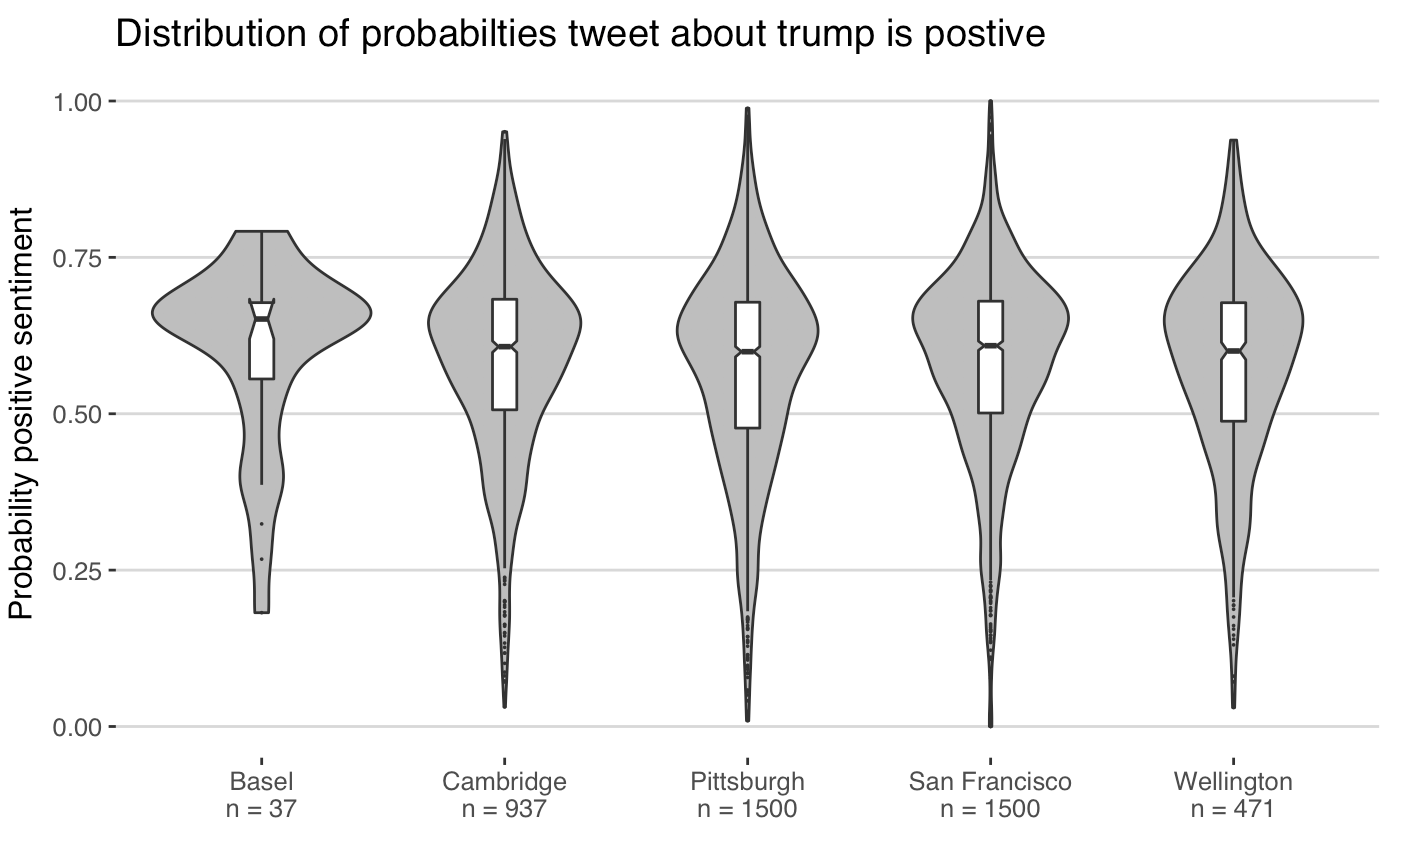
Views about Trump by city
Here I just searched twitter for tweets mentioning Trump, that weren’t retweets. Interestingly there wasn’t much differentiation in the likelihood a tweet was positive by city. This might be due to inaccuracy of my classification model, or simply a reflection of the fact that there might not be that great of a difference in the way twitter users post about Trump across the different locations.
James Black
PhD (Cantab)
James Black. Kiwi | Epidemiologist | Data Scientist | Engineering enthusiast.