New Zealand and sheep
Looking at the data to see if New Zealand still deserves the sheep jokes.
When I say I grew up in New Zealand, a sheep joke often rears it’s head. I’ve always wondered how well that stereotype actually fit modern New Zealand. The claim we have 60,000,000 sheep comes up fairly frequently, but I had no idea if that was close to the contemporary population. Thankfully, Stats NZ provides the numbers, and below I’ve plotted the numbers I got from their website.1
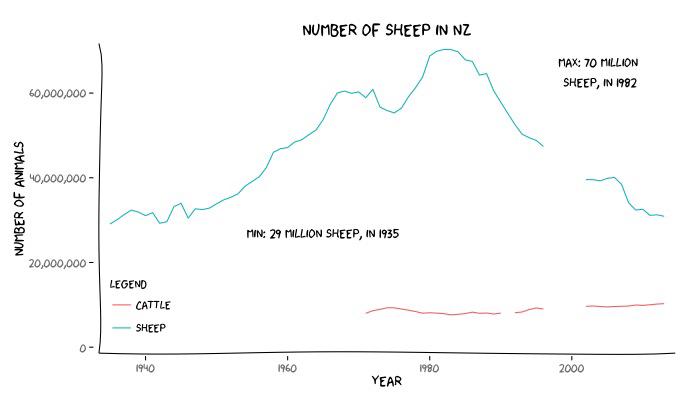
So how many sheep are there?
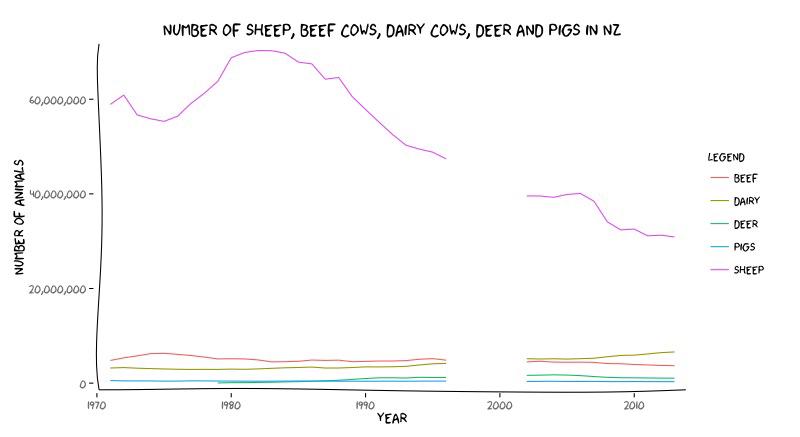
So at one point there were 70,301,461 sheep in New Zealand. That was back in 1982 though. The number of sheep in 2013 was 30,904,714. Now I’m assuming this is sheep declared to the tax man (I’m hazy on where Stats NZ got such an exact number from), but I doubt it’s too much higher in reality.
To put the numbers in context, in 2012 there were 10.8 million sheep in the UK2 and 74.4 million in Australia3.
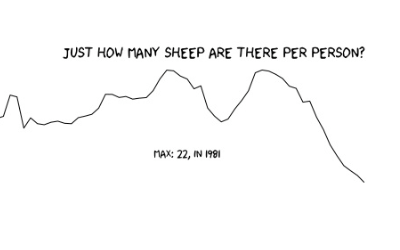
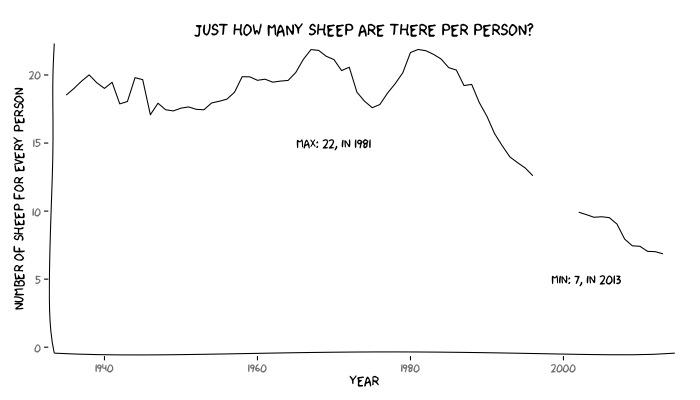
And the number per person?
So in 2013 there were 30,904,714 sheep and 4,504,600 people. So that’s 6.86 sheep to every person. Back in 1981 though, there 21.79 sheep to every person in New Zealand.
In 2012 in the UK, there were 0.2 sheep per person, and 3.3 per person in Australia.4 So compared to the British and Australians we’re the bigger sheep lovers. After the Kiwi’s, it’s the Welsh that tend to bare the brunt of the sheep jokes. In Wales there are 2.8 sheep to every person - so looks like the jokes are best directed at the Kiwi’s after all.
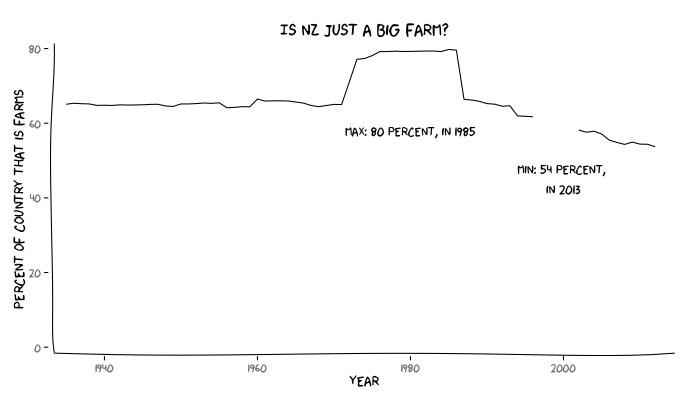
And how much is farm land?
New Zealand’s fertile lands gave it the nickname “Britain’s Breadbasket”5 and, historically at least, huge swathes of the country were farmland.
I’d love to know what happened in the 70’s and 80’s. I’m guessing the abrupt change may have had something to do with forestry, or it could be as mundane as a change in the way land was classified. The Stat NZ site doesn’t have detailed breakdowns from back then but the answer must be somewhere in the data.
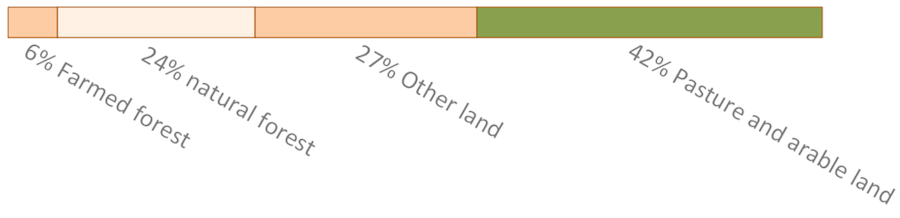
A forestry report6 I found claims that in 2010 land use was supposedly broken down like below (I’ve replotted the reports pie graph as a bar chart, although I haven’t been fully converted to being a pie-chart zealot by Tufte yet7). While the UK was about 69% farmland and 9% forest in 2010.8
Despite NZ having the reputation of being greener, a greater of proportion of the UK is farmland. This doesn’t seem to make sense, and there may be some difference in how land use is measured, but it’s also due to the fact that around 30% of NZ is currently a national park9, while the proportion is only around 9% in the UK10.
While I was looking for the number of sheep in Australia I stumbled across a page on the Stats NZ site were they had already answered my first question.11 They’ve gone and explored a bunch of other myths about NZ as well, and the page is well worth a gander.
Cows in NZ
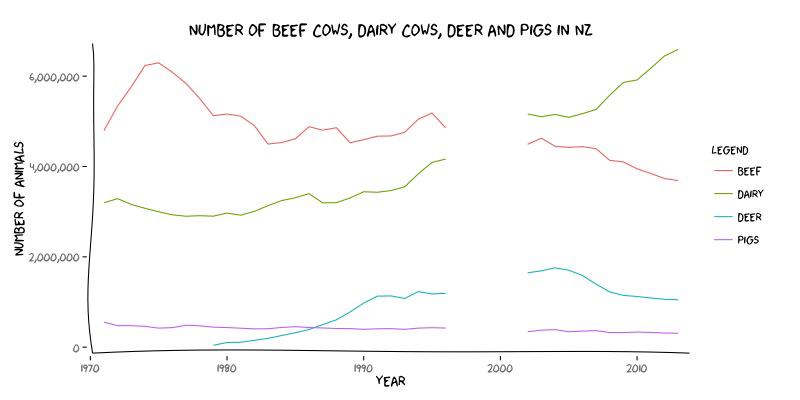
EDIT:: my cousin mentioned she’d like to see how the cow population has changed. Below I plotted the number of dairy cows, against beef cows, with deer and pigs thrown in. This data only starts in the 70’s, unlike the sheep data which starts in the 30’s.
And finally, to put the plot above in context, with sheep as well.
Stats NZ site http://www.stats.govt.nz/tools_and_services.aspx ↩︎
Eblex report http://www.eblex.org.uk/market-intelligence-news/uk-sheep-numbers-regional-breakdown/ ↩︎
Meat and Livestock Australia http://www.mla.com.au/Cattle-sheep-and-goat-industries/Industry-overview/Sheep ↩︎
I just used wikipedia’s 2012 population estimates for the two countries. ↩︎
Ministry for Primary Industries report http://www.mpi.govt.nz/portals/0/documents/forestry/statistics/forestry-stats/facts-figures-11-12.pdf ↩︎
Edward Tufte gives the pie chart a more succinct and decisive treatment in “The Visual Display of Quantitative Information” https://news.ycombinator.com/item?id=2991062 ↩︎
Not from the most reliable source… hccmpw.org.uk/index.php/tools/required/files/download?fID=2086 ↩︎
http://en.wikipedia.org/wiki/Protected_areas_of_New_Zealand ↩︎
http://en.wikipedia.org/wiki/National_parks_of_England_and_Wales ↩︎
Mythbusters site http://www.stats.govt.nz/browse_for_stats/population/mythbusters.aspx ↩︎
James Black
PhD (Cantab)
James Black. Kiwi | Epidemiologist | Data Scientist | Engineering enthusiast.