Scottish independence polls
Smoothing six Scottish independence polls six days out from the vote.
I’m currently doing an online course focusing on data management.1 As part of that course I’m learning how to scrape information from websites, using R, when they don’t give you an API for easy access. To practice what I learnt, I had a go at scraping the data from the BBC’s Scottish independence poll tracker. After checking the page source, I saw the data in a javascript file.2
As it took me over an hour to figure out how to read that file, I thought I should probably plot the hard won data.
The raw data
Below is the data I pulled from that file. It contains 58 polls taken by six different companies. The first plot is just the raw data as a line graph.
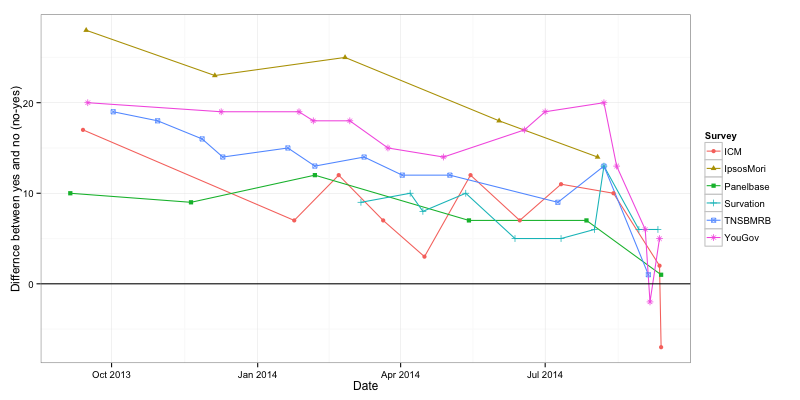
Simply smoothed
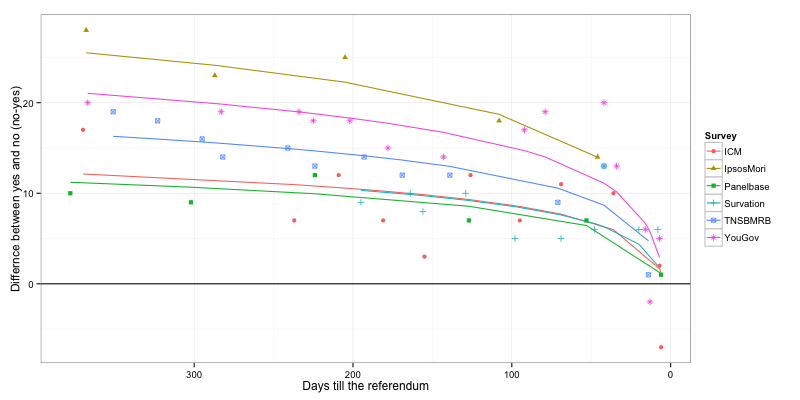
Again, the raw data, but this time smoothing the lines using locally weighted regression.

Treating the polls as not independent
For this last figure, I’ve assumed that the polls are related to each other using a multilevel model. As these polls are quite different in their methodology, I’ve let the slopes and intercepts vary for survey companies. Days till the vote is treated as something that is constant across the companies (I didn’t look into whether this is actually true). As the slopes don’t look linear, I’ve transformed the time variable in the model. The residuals get quite iffy when you get close to the voting day, so the model shouldn’t be taken seriously (having said that - the model suggests that 6 days out the ‘better together’ group have a lead of 1.1%).
The model:
The data source
This data was pulled from the .js file that runs the BBC poll tracker, which is here.
The course https://www.coursera.org/course/getdata ↩︎
The js file I was practicing my parsing skills on http://news.bbcimg.co.uk/news/special/2014/newsspec_7419/english/js/data/polls.js ↩︎
James Black
PhD (Cantab)
James Black. Kiwi | Epidemiologist | Data Scientist | Engineering enthusiast.