Tracking our attempts to setup our new home
Taking stock of the MOOCs I tackled while on paternity leave.
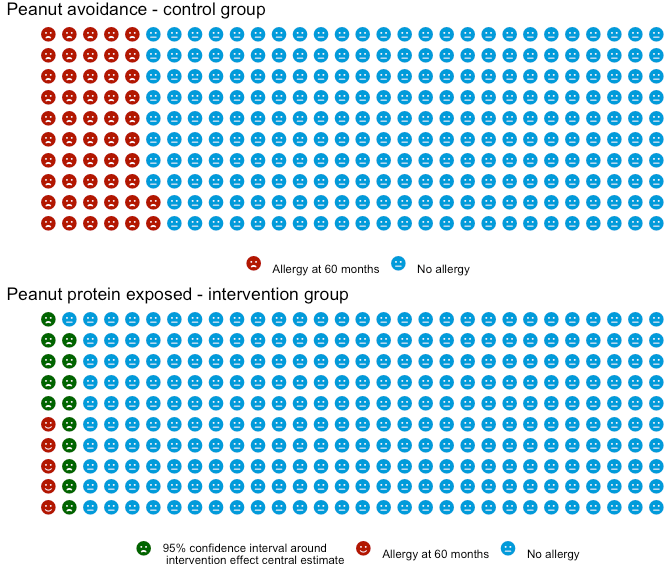
Trying to find an easier way to display relative risks
Trying to understand the studies behind weaning guidance
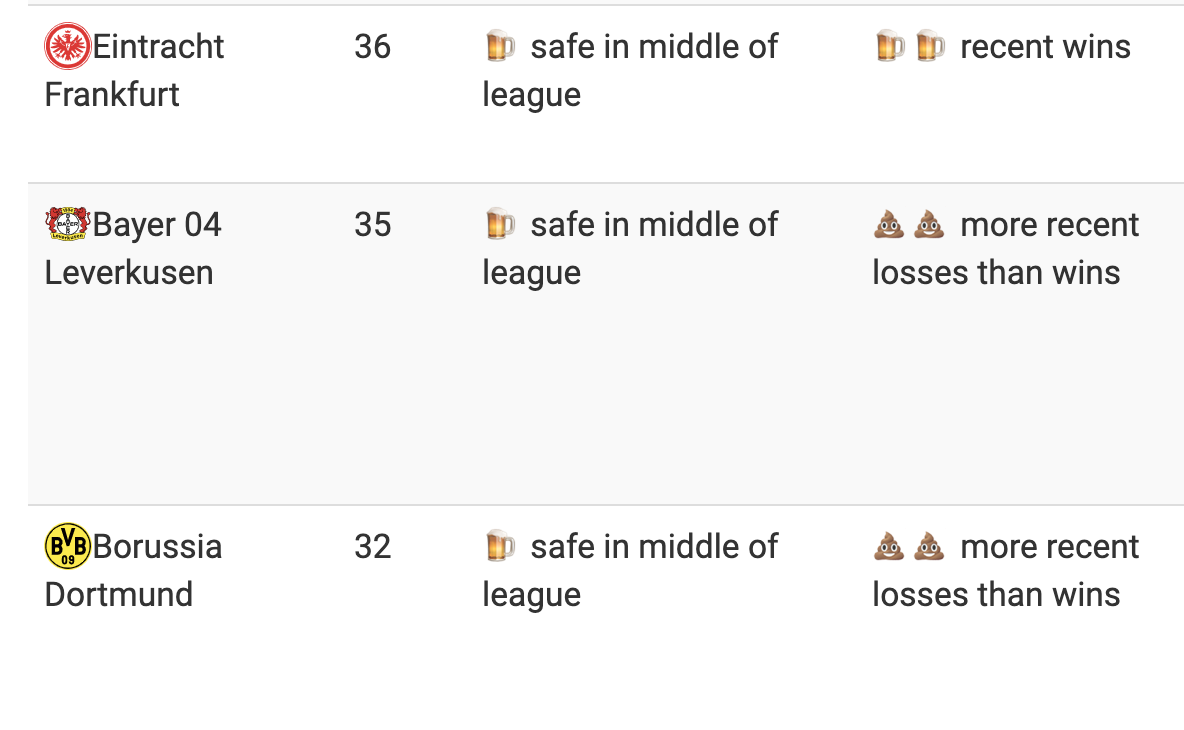
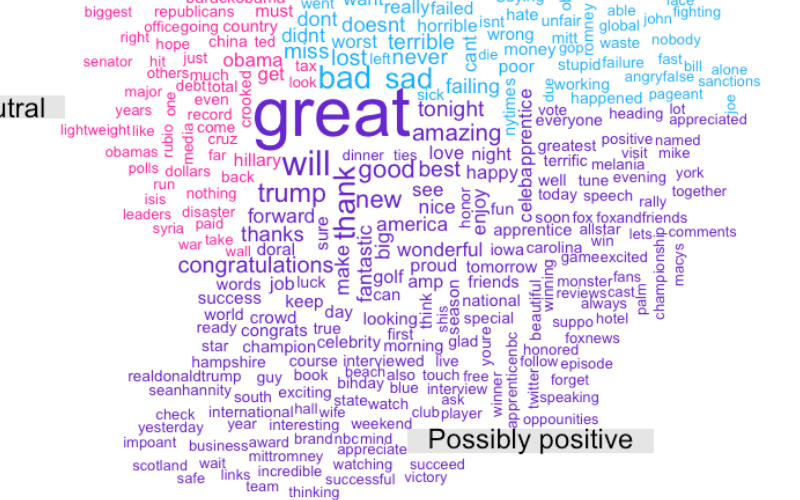
Getting football data, then summarising a fan’s mood based on the
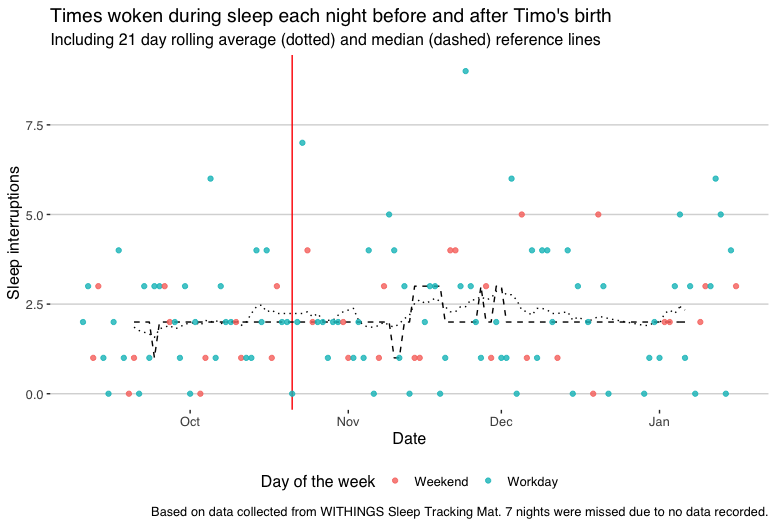
Looking at my time asleep pre and post the arrival of baby Timo.
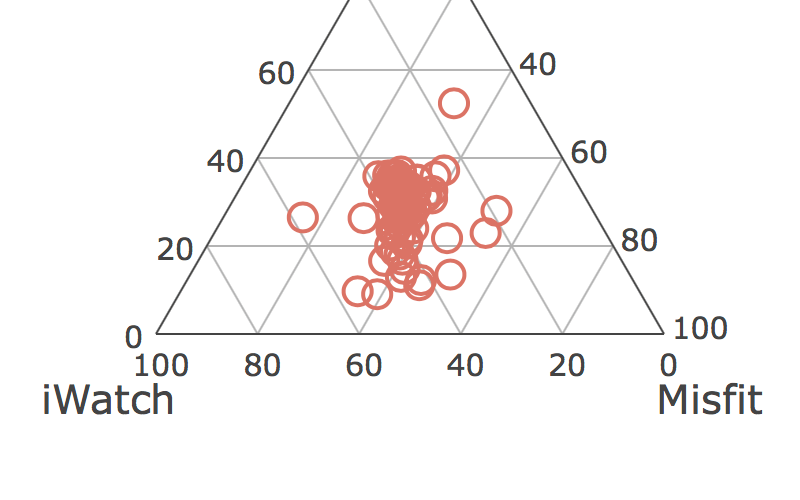
Analysing my physical activity health data generated from my devices.
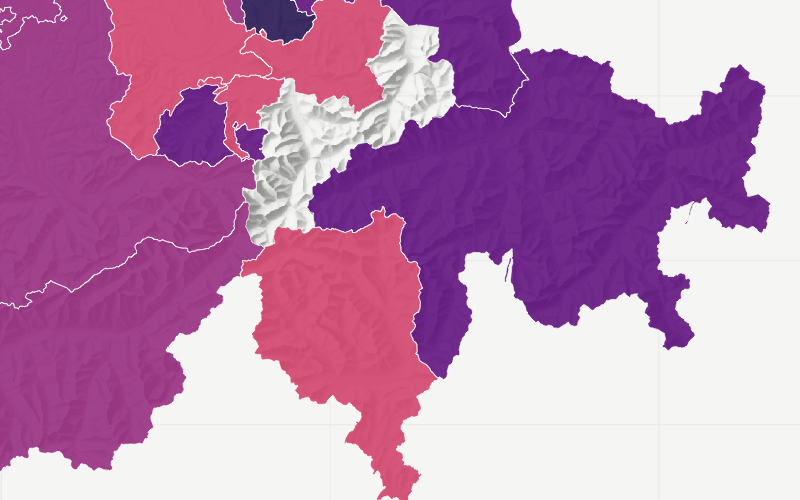
Scraping a few days of Swiss tweets to see what languages are used in what Cantons.
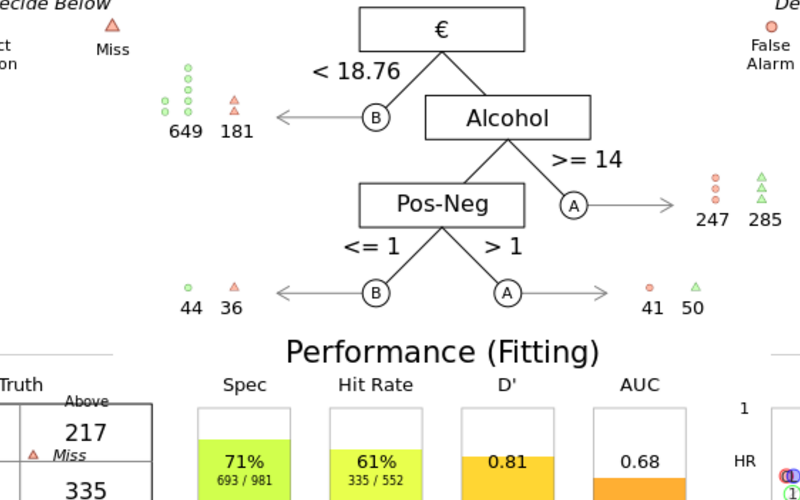
Comparing prediction accuracy by model choice.
Building a tweet classifier from 1.6 million coded tweets.
Taking alerts to the next level - flashing the house lights!.
Scraping German and Kiwi wine reviews for some machine learning.
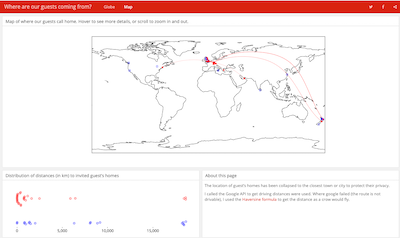
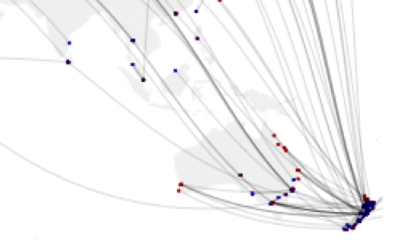
Plotting on a globe where my wedding guests are coming from.
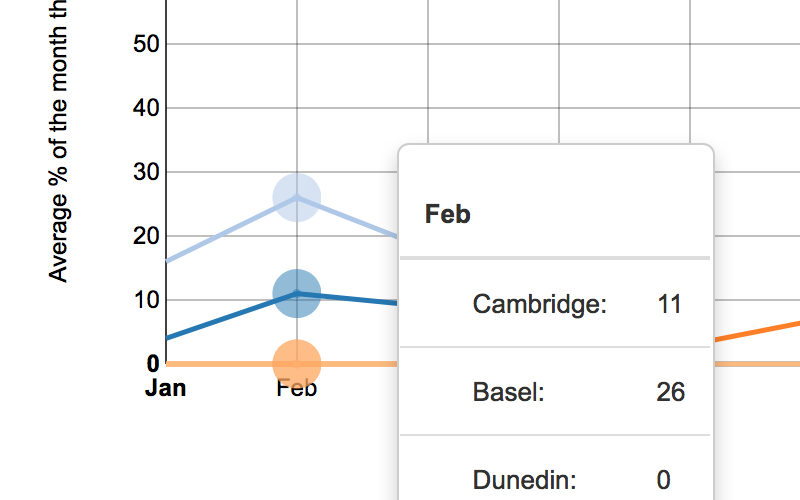
Comparing historical weather records from four cities I’ve lived in.
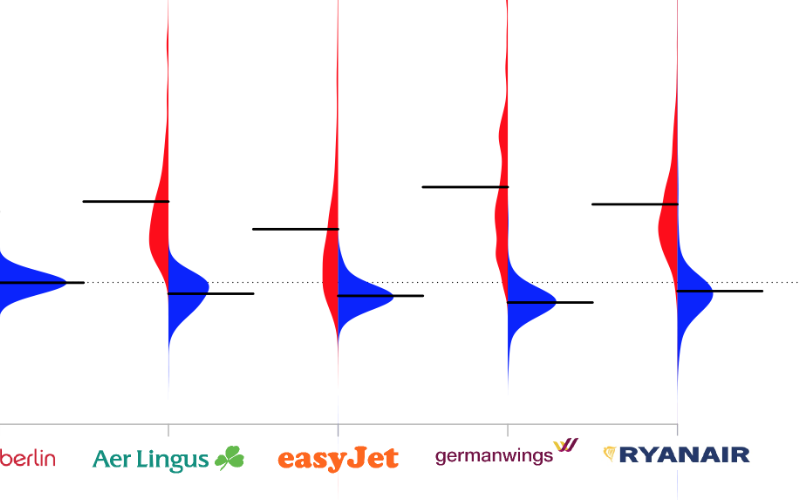
Testing the urban legend that Ryan Air fakes their on time data.
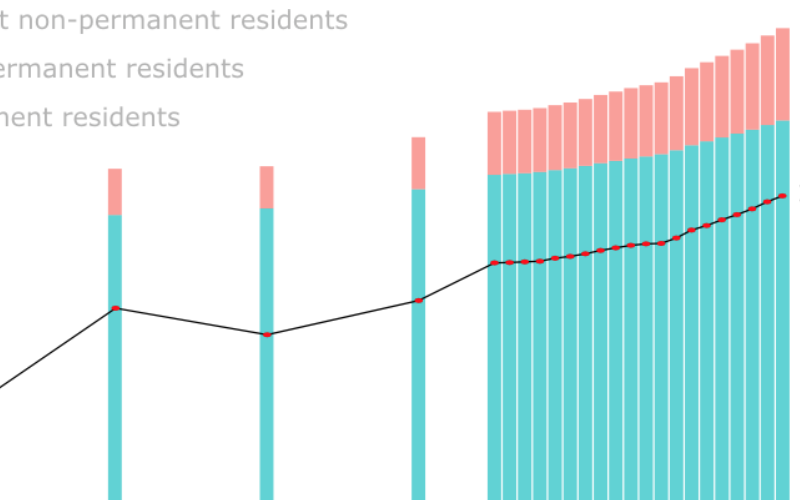
The swiss expat in data.
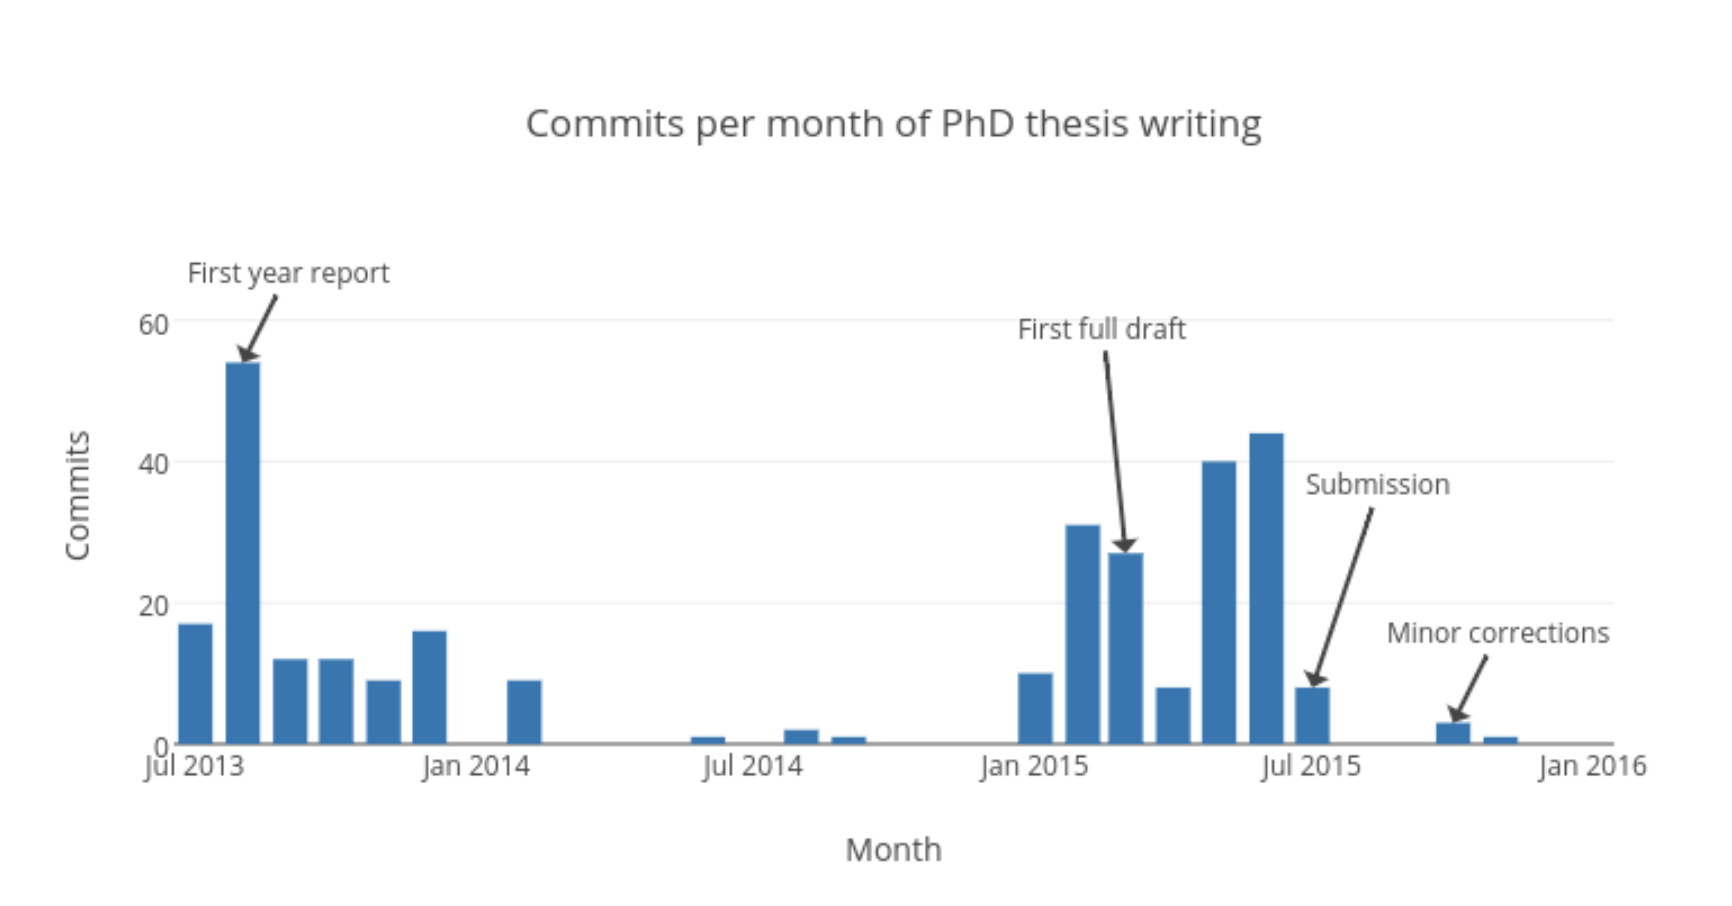
A number based breakdown of my PhD.
Using R to build an interactive weather app.
Plotting when the weather is nice in Cambridge.
Plotting Cambridge crime data on a map using R.
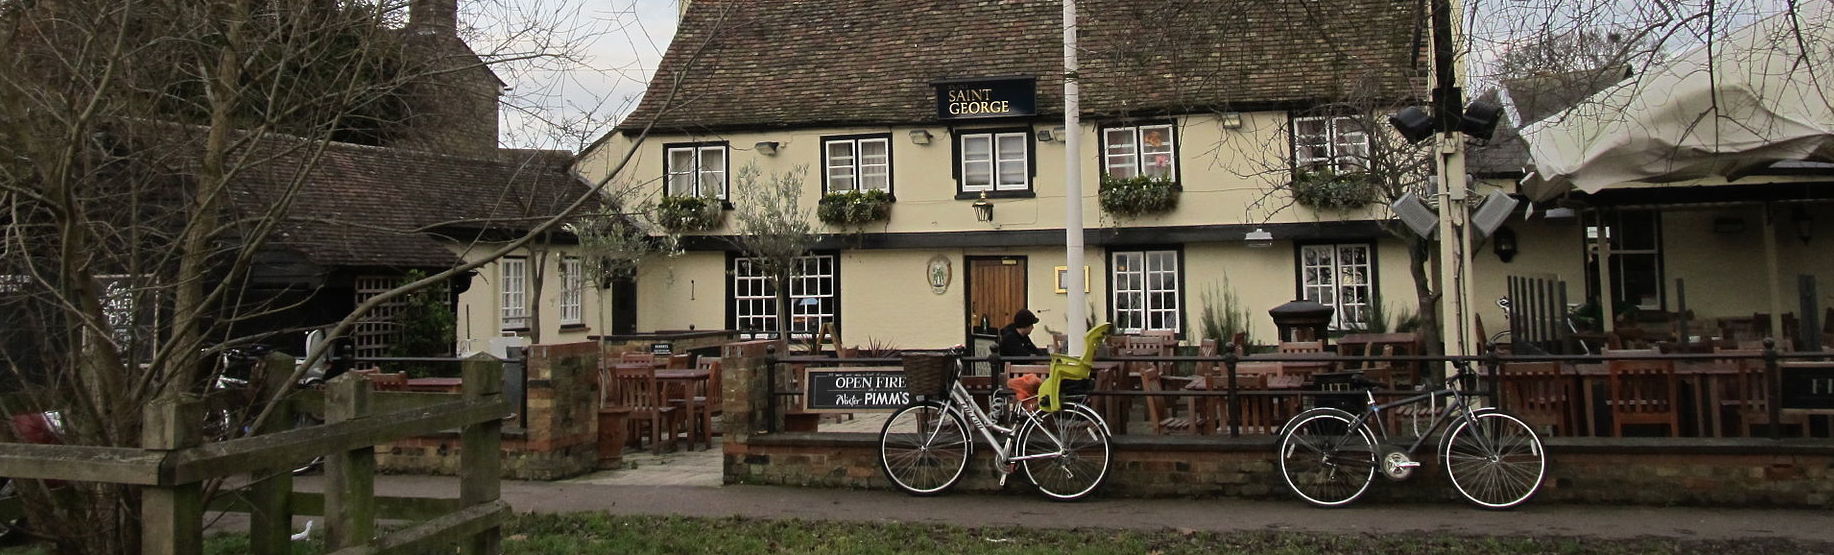
Building a matrix of the distance to the nearest pub using FSA and google data.
Facebook friend migrations (great circles and geocoding in R).
Smoothing six Scottish independence polls six days out from the vote.
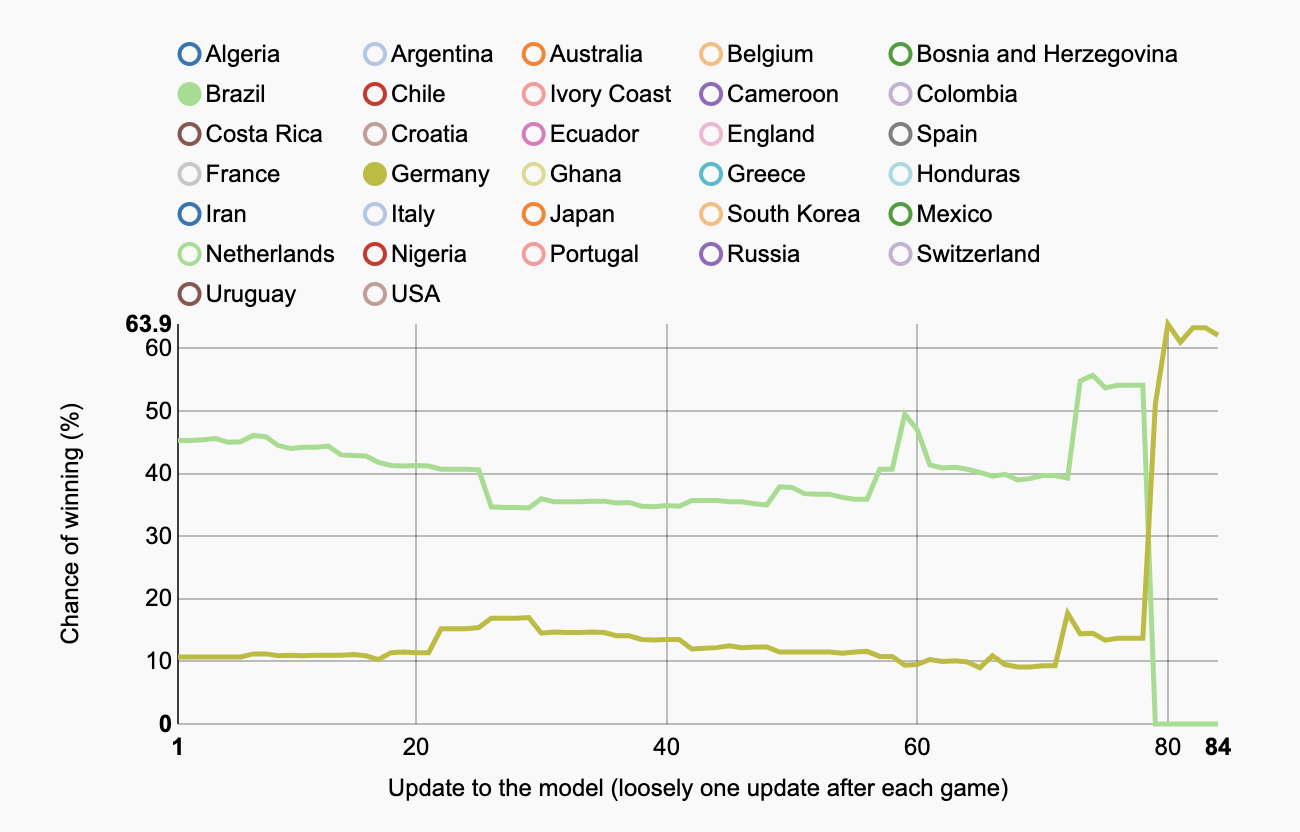
Looking at how FiveThirtyEights predictions for the world cup winner changed.
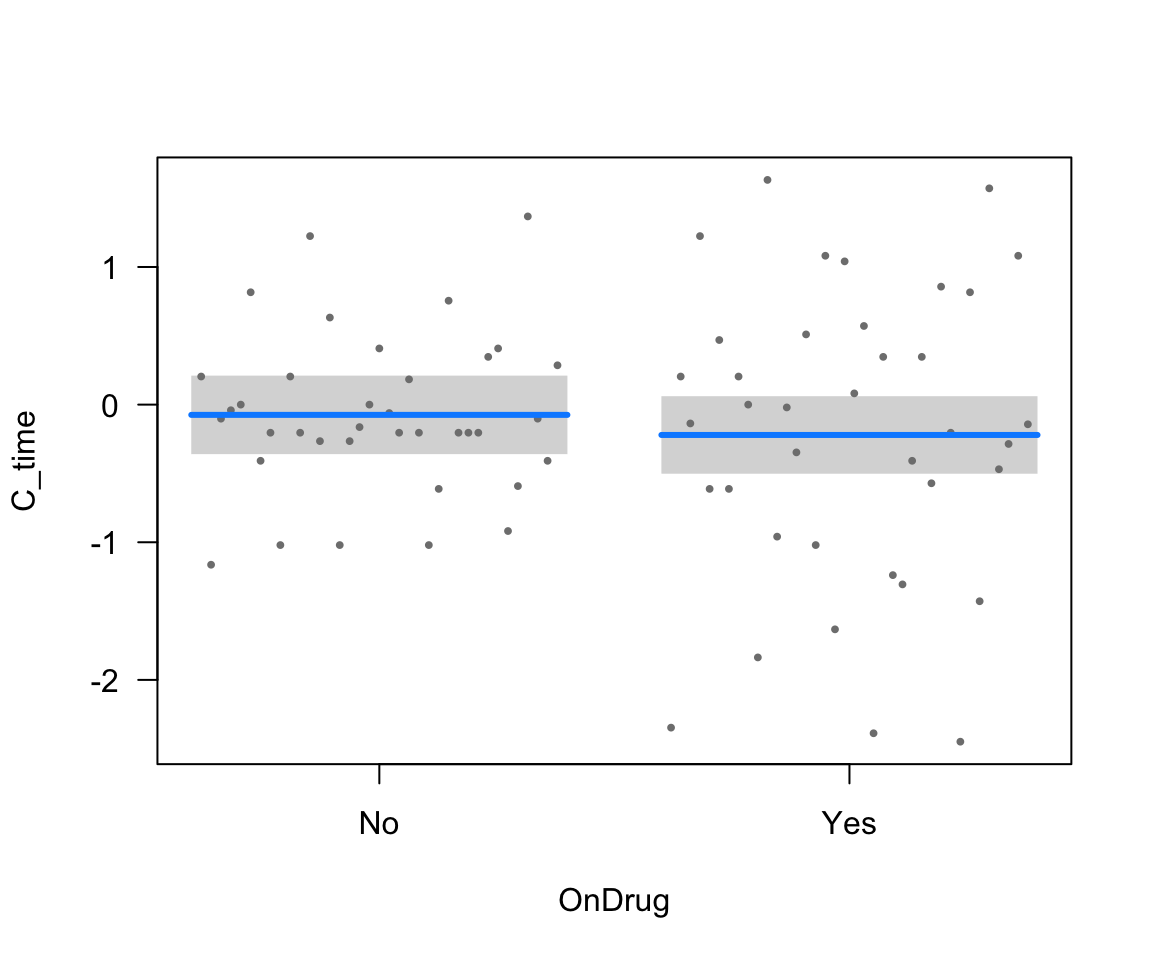
Caffeine RCT by students from my Cambridge Tradition class.
Using the D3 javascript library to visualise Simpson’s paradox.
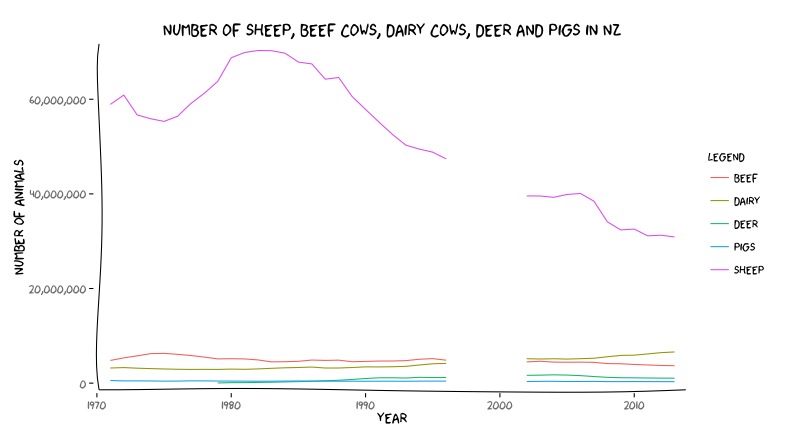
Looking at the data to see if New Zealand still deserves the sheep jokes.
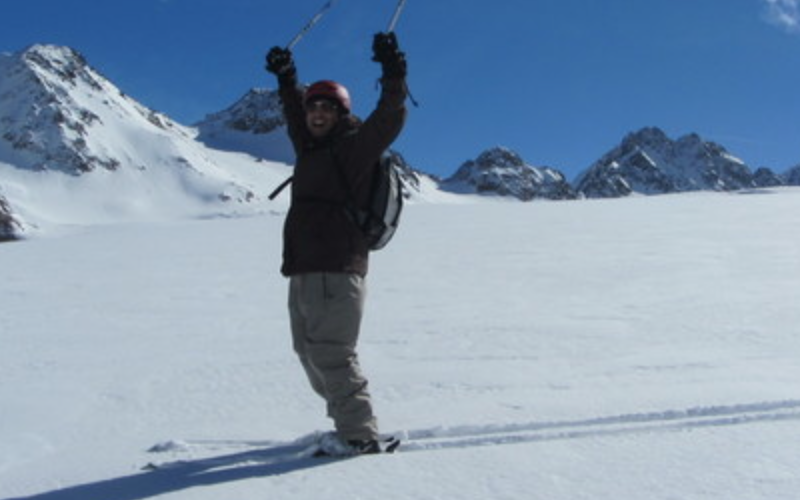
Plotting data from the ski tracks app using R, from a recent trip to Pitztal Glacier.
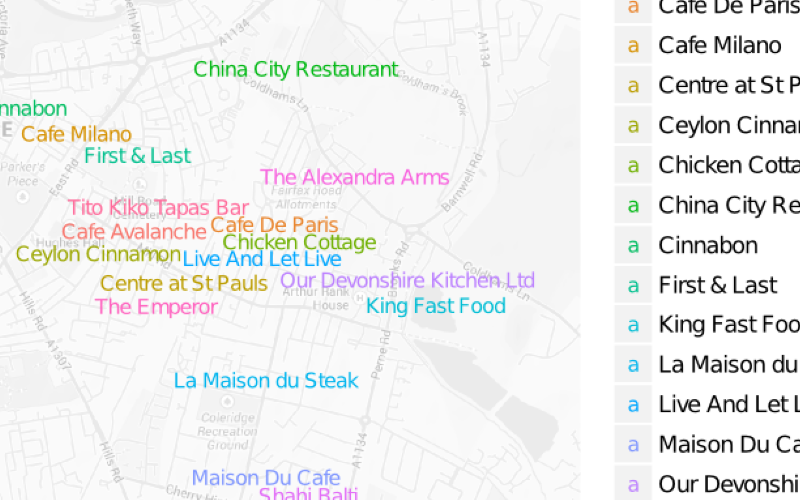
Plotting Cambridge restaurant cleanliness using R.
---
title: Blog Posts
listing:
  contents: "*.qmd"
  type: grid
  grid-columns: 3
  sort: "date desc"
  categories: true
  feed: true
  sort-ui: true
  filter-ui: true
  page-size: 50
---